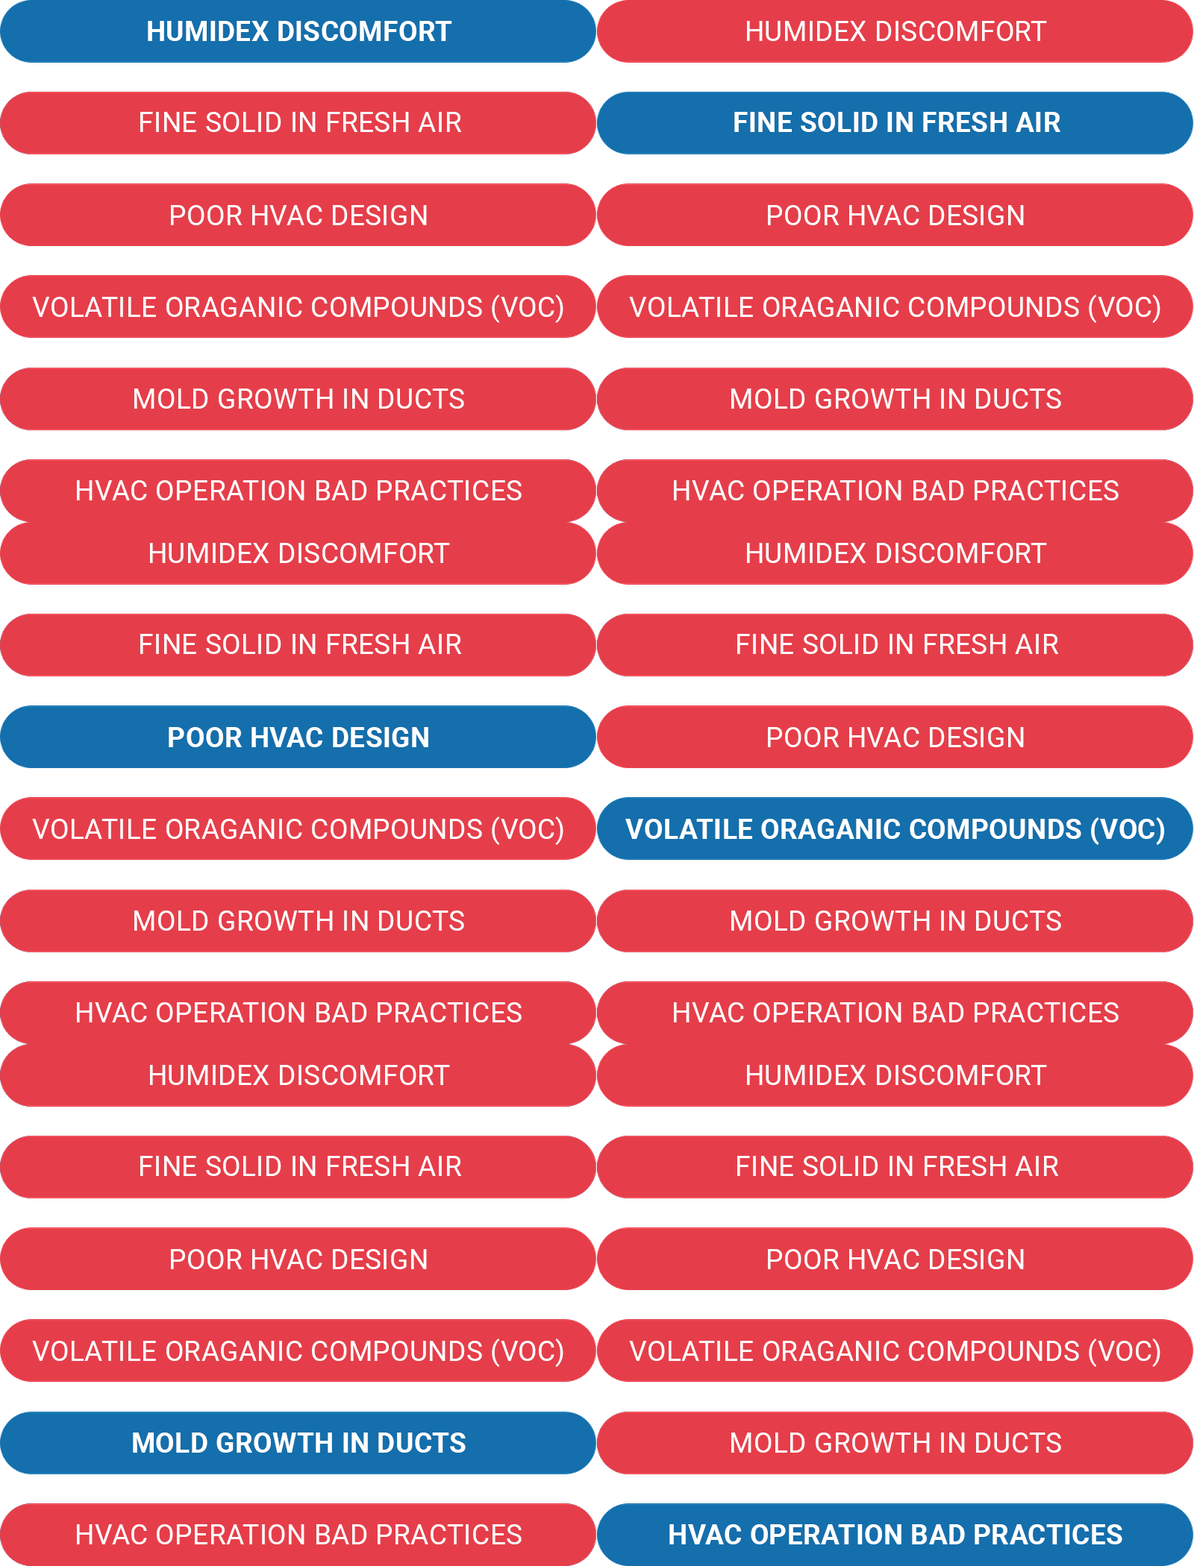
Causes

Sick Building
Results


| Statistic | Year | Root Cause | Source |
|---|---|---|---|
| 40% of people are more likely to have asthma | 2017 | Damp or mouldy homes | European Union |
| Statistic | Year | Root Cause | Source |
|---|---|---|---|
| 40,000 deaths per year | 2017 | Indoor air pollution | United Kingdom |
| Statistic | Year | Root Cause | Source |
|---|---|---|---|
| Annual loss of over 200,000 healthy life years | 2015 | Indoor air pollution | United Kingdom |
| Statistic | Year | Root Cause | Source |
|---|---|---|---|
| 57% of healthy life years relate to cardiovascular diseases, 23% to lung cancer, 12% to asthma | 2015 | Indoor air pollution | United Kingdom |
| Statistic | Year | Root Cause | Source |
|---|---|---|---|
| Cognitive scores were 61% higher in Green buildings and 101% higher in Green+ buildings | 2016 | Green vs conventional buildings | United States |
| Statistic | Year | Root Cause | Source |
|---|---|---|---|
| Strategy scores were 183% higher in Green buildings and 288% higher in Green+ buildings | 2016 | Green vs conventional buildings | United States |
| Statistic | Year | Root Cause | Source |
|---|---|---|---|
| 30% fewer had sick building symptoms | 2016 | Green vs conventional buildings | United States |
| Statistic | Year | Root Cause | Source |
|---|---|---|---|
| 76,000 (50%) of pneumonia deaths in children | 2016 | Indoor air pollution | India |
| Statistic | Year | Root Cause | Source |
|---|---|---|---|
| 1.5 million people killed by indoor air pollution | 2016 | Indoor air pollution | India |
 + Health + Comfort + Energy + Money

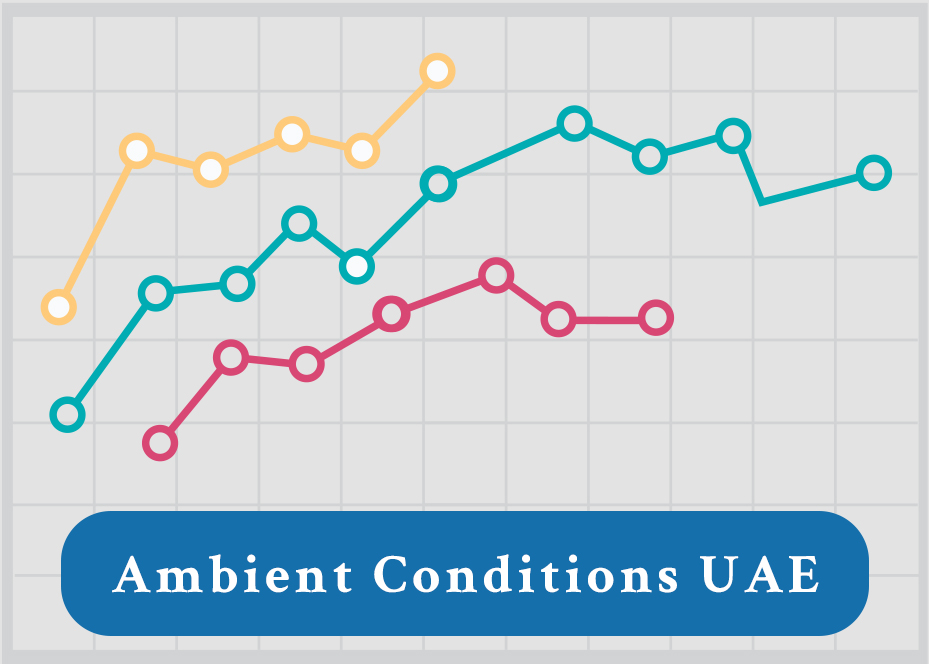


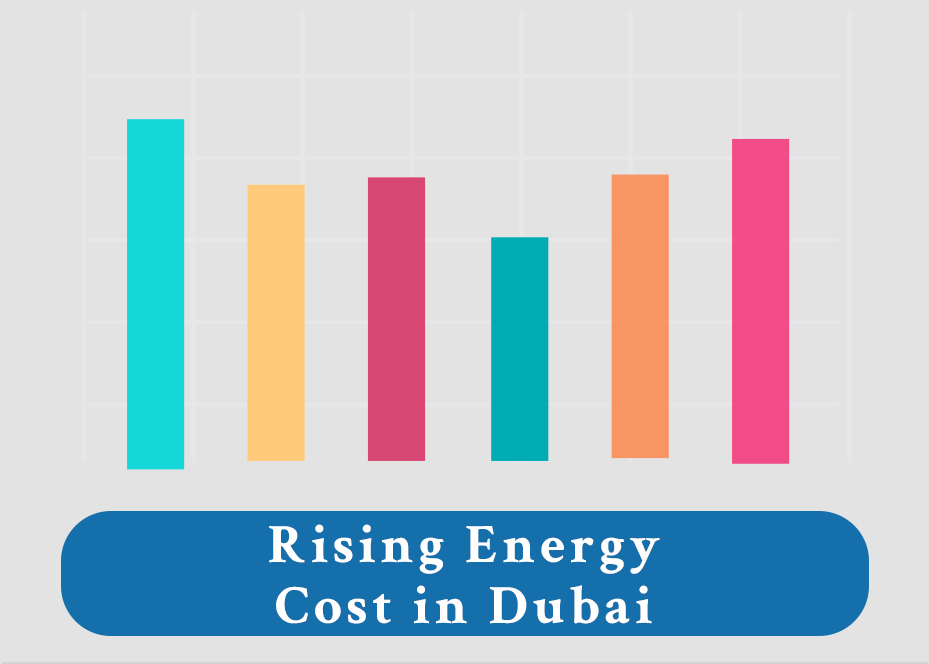

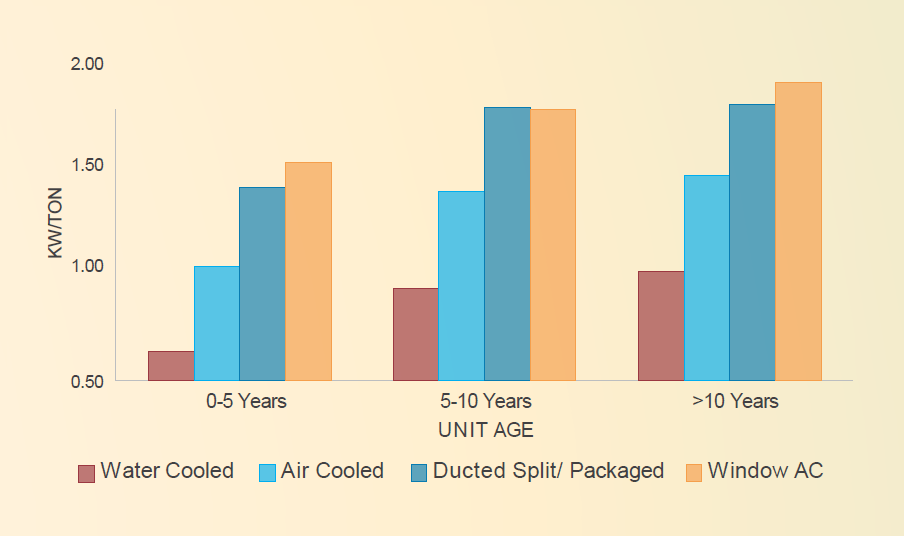
Energy Consumption of Cooling Systems

Equipment Aging/Rising Energy
A study on Annual Economical Gains by improving IAQ (only) in USA Office buildings
| Source of Productivity Gain | Potential Annual Health or Productivity Benefits | Potential U.S. Annual Savings or Productivity Gain (1996 $US) |
|---|---|---|
| Reduced respiratory illness | 15% to 76% decrease (16 to 37 million cases of common cold and influenza avoided) | $ 6 -$ 14 billion |
| Reduced allergies and asthma | 8% to 25% decrease in symptoms for 53 million allergy sufferers and 16 million asthmatics | $ 1 -$ 4 billion |
| Reduced sick building syndrome symptoms | 20% to 50% reduction in sick building syndrome health symptoms | $ 10 -$ 30 billion |
| Improved worker performance from changes in thermal environment and lighting | 0.5% to 5% improvement in office worker productivity | $ 20 -160 billion |
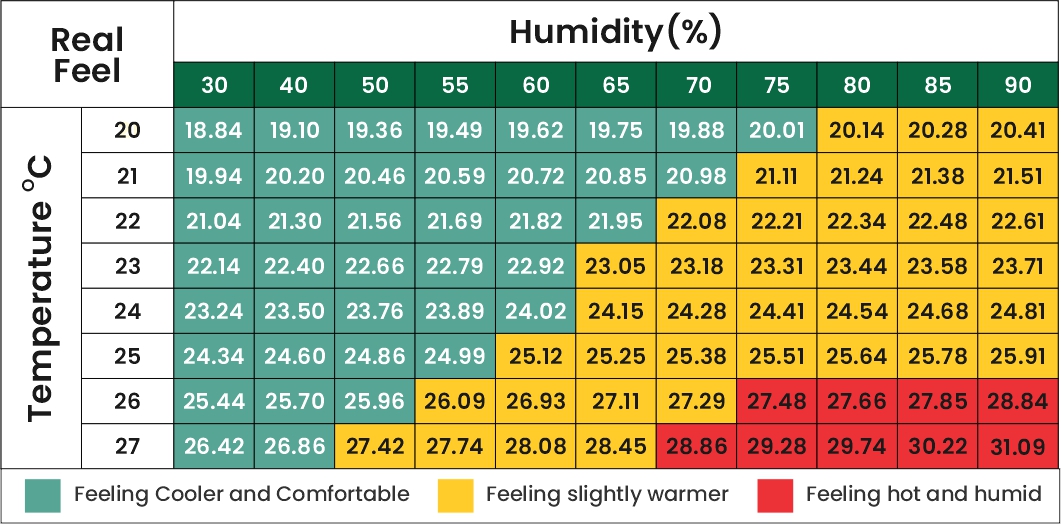
Humidity level and Real Feel Effect
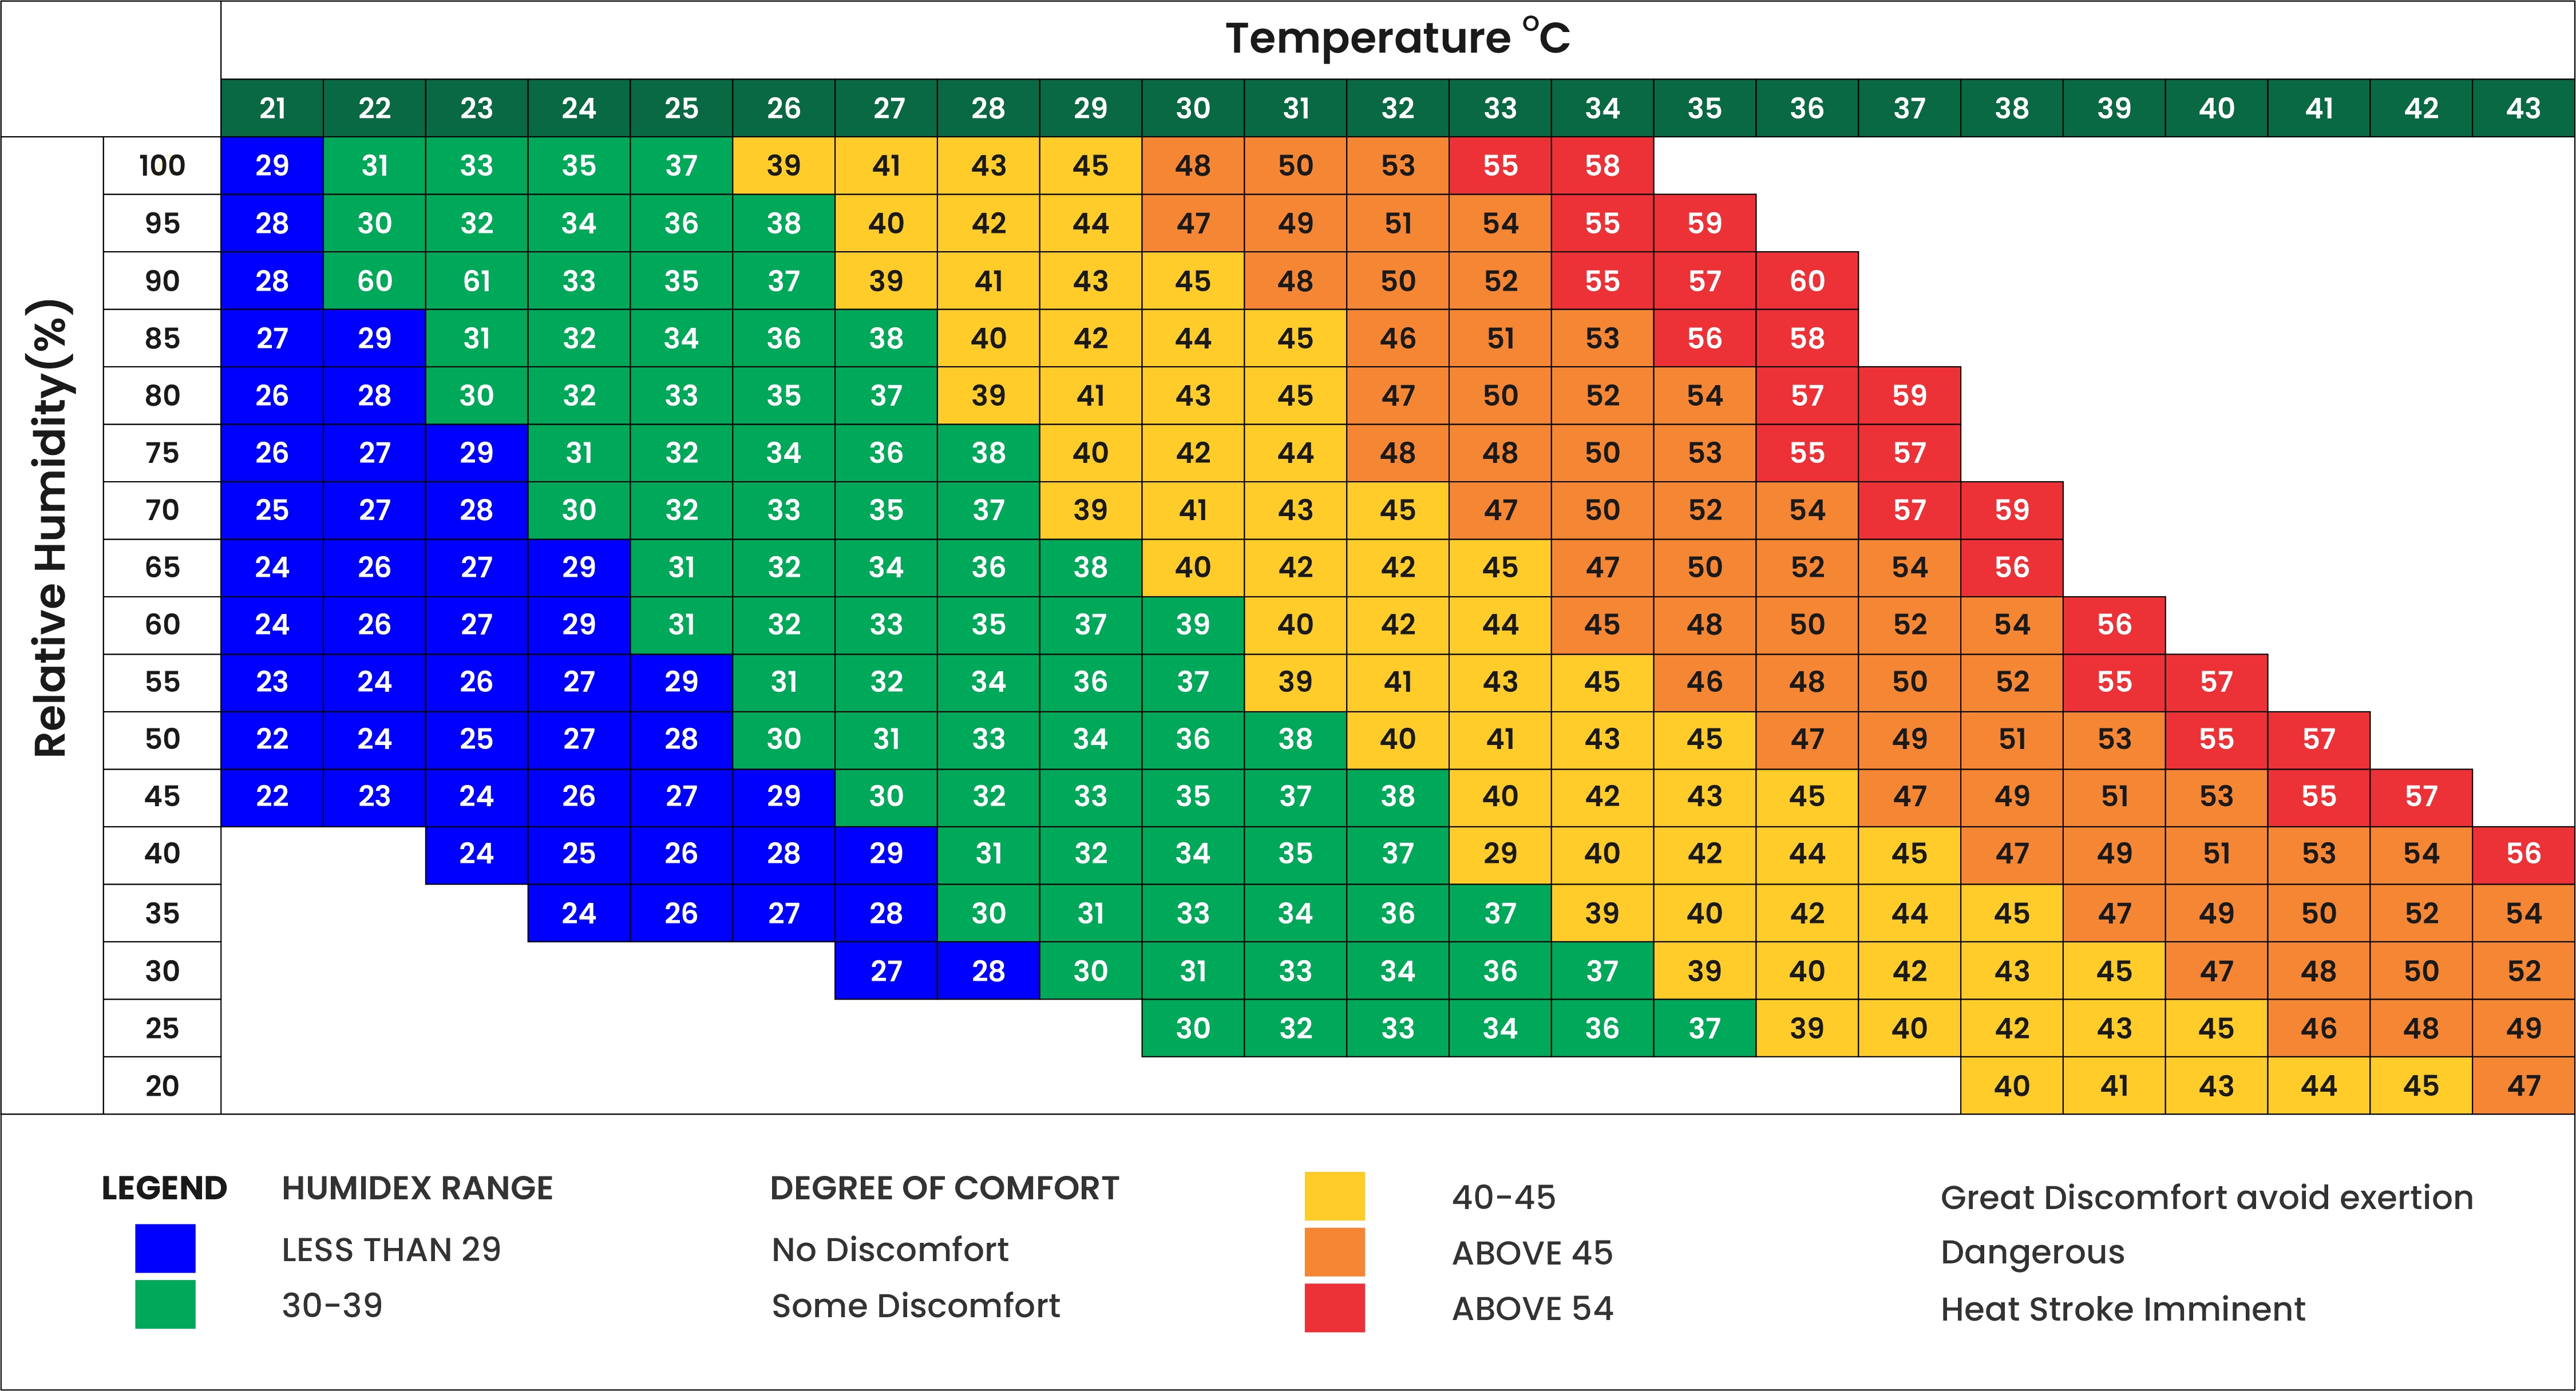
Humidex –Humidity and comfort level
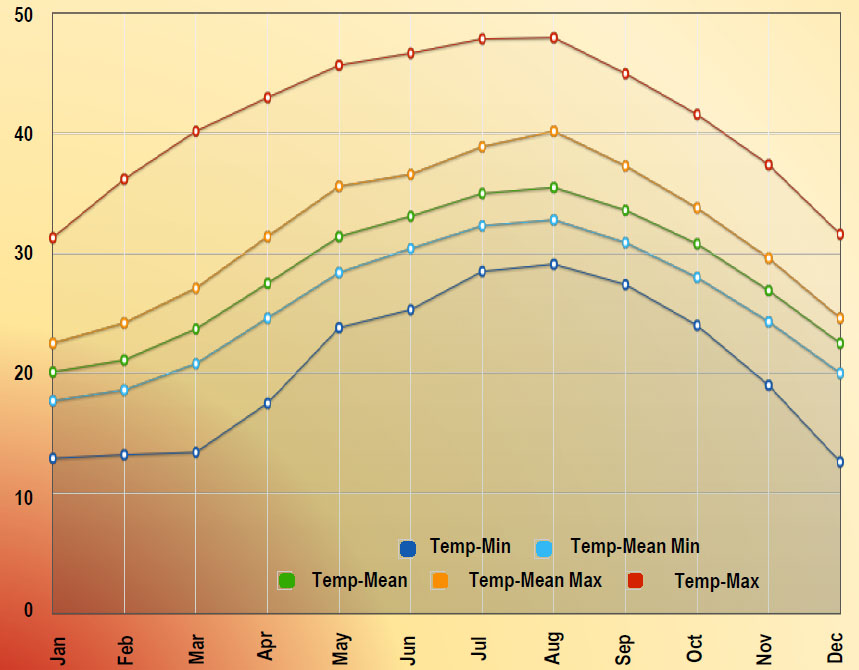
Air Temperature (OC)from 2003 to 2018
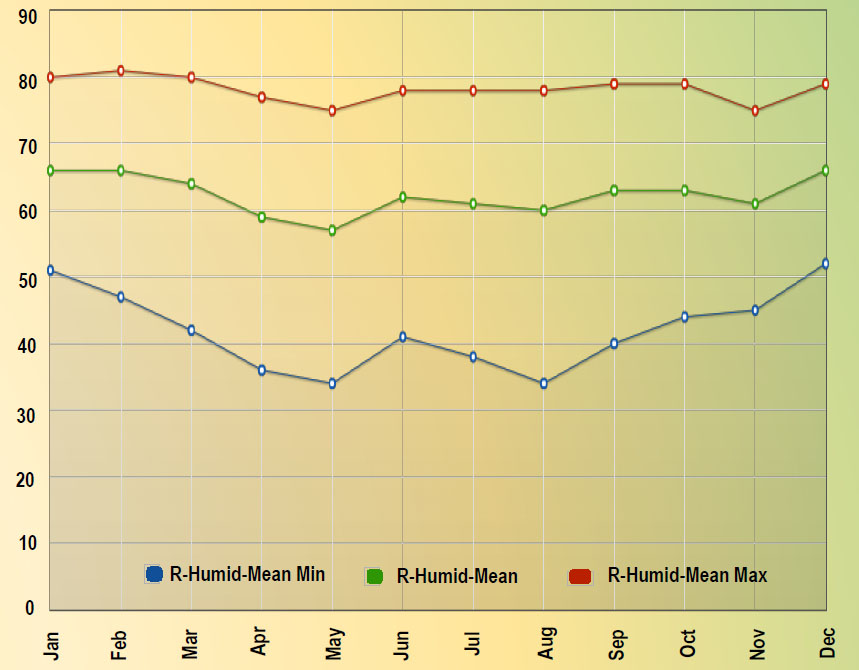
Relative Humidity (%)from 2003 to 2018
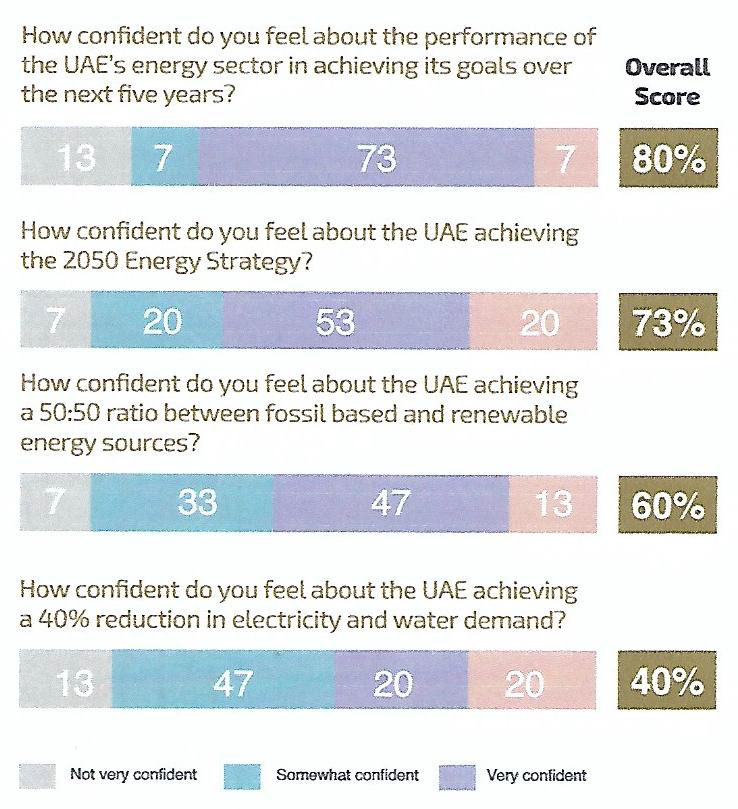
Confidence Level of Energy Leaders
